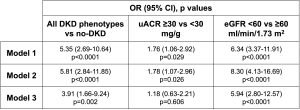
Background: The diverse DKD phenotypes (DKD-Ph), with many cases of reduced eGFR without albuminuria, require the identification of new biomarkers to improve cardio-renal risk estimation. FABP1 is expressed in the proximal tubule and participates in fatty acid metabolism. Many studies investigated urinary FABP1 as a marker of renal damage, a few the role of plasma FABP1. This study explores the relationship between plasma FABP1 and DKD in T2DM. Materials and methods: uACR≥30 mg/g and/or eGFR<60 ml/min/1.73 m2 define four evenly distributed DKD-Phs. FABP1 was measured by ELISA assay (HK404, Hycult Biotech, Uden). Its role was explored in 1. any DKD (n. 189) vs no-DKD (n. 67); 2. increased (n. 127) vs normal uACR (n. 129); 3. eGFR<60 (n. 126) vs ≥60 (n. 130); 4. each DKD-Ph [uACR increased only (Alb+, n. 63), non-albuminuric DKD (Alb-DKD, n. 62), and albuminuric DKD (Alb+DKD, n. 64)] vs no-DKD (n. 67). Results – In 256 T2DM (77% men, 64±7 years age, DD 14±9 years, HbA1c 7.0±1.0%), plasma FABP1 levels were 23.6 (IQR: 18.0-32.9) ng/mL. FABP1 correlated with BMI, HbA1c, lipids, uric acid, liver enzymes, uACR (r=0.207, p=0.001) and eGFR (r=-0.475, p<0.0001). The table reports the associations between LnFABP1 and DKD-Phs, uACR levels and eGFR values derived from unadjusted logistic regressions (FABP1 only; model 1), adjusted for age and sex (model 2), and adjusted also for DD, smoking, BMI, BP, HbA1c, lipids, and uric acid (model 3).FABP1 was similar in no-DKD and Alb+ (p=0.123), higher in Alb-DKD and Alb+DKD (p<0.0001 for both), with no differences between the latter (p=0.156). Compared to no-DKD, FABP1 was marginally associated with Alb+ in models 1 and 2, while it was independently correlated, in all models, both with Alb-DKD (Model 3: OR 10.34 [2.78-39.40], p<0.0001) and Alb+DKD (Model 3: OR 25.31 [4.59-139.67], p<0.0001). Compared to Alb-DKD, FABP1 was not an independent covariate of Alb+DKD. Conclusions: In T2DM, plasma FABP1 levels are differentially associated with uACR, eGFR, and DKD phenotypes. The association is stronger with the eGFR reduction than with the uACR increase. Funding: PRIN 2020 (2020SH2ZZA).