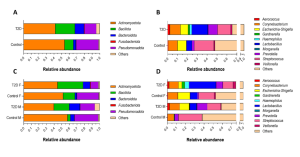
Lower urinary tract symptoms (LUTS) are common in type 2 diabetes (T2D), affecting quality of life and potentially leading to medication discontinuation. Among various factors contributing to LUTS, recent observations suggest a critical role of the urinary microbiota. Research on urinary dysbiosis in T2D remains underexplored. We conducted a pilot case-control study to investigate differences in the urinary microbiota between T2D patients (n=50, 32% women) with no previous history of LUTS and healthy individuals (n=25, 60% women), and its potential indirect association with LUTS risk. Microbial DNAs were extracted from urinary sediments and bacterial populations quantified by Real-Time qPCR and qualitatively investigated by 16S rRNA gene sequencing. Validation experiments with Digital PCR were also performed. In the whole cohort of T2D, a higher total bacterial load (p=0.0473) and an increased abundance of Bacillota (p=0.0463) vs controls were found. After stratification by gender, these results were confirmed only in women (p=0.0361 and p=0.0075, respectively). However, no significant quantitative differences were observed at the genus level. The prevalence of bacterial species such as E. Coli, E. Faecalis, C. Coyleae and Glucuronolyticum, L. Iners (all p<0.0001), G. Vaginalis (p=0.0003), C. Ureolyticus (p=0.0015) significantly differed, too. At the species level, a substantial qualitative and often gender-dependent shift was present in T2D individuals (Fig. 1). The urinary microbiota of subjects with T2D is different from that of healthy controls. Specifically, T2D patients displayed higher total bacterial load and Bacillota levels, as well as qualitative changes in bacterial species. These changes suggested a dysbiotic condition of the urinary microbiota of T2D subjects, with some gender-related differences. Although causality cannot be inferred, these findings highlight the impact of T2D on the urinary microbiota and its potential relevance in developing LUTS and, from a broader perspective, metabolic abnormalities. Figure 1 Relative abundances obtained from 16S-based metagenomic analysis: A) main phyla in controls and T2D subjects; B) main genera in controls and T2D subjects; C) main phyla in controls and T2D subjects differentiating on the basis of gender; D) main genera in controls and T2D subjects differentiating on the basis of gender.


